…In a nutshell, what brands do you buy and why?
The awareness of the brand, the loyalty of the users of the brand and how much they like the brand are all rather academic constructs as all these measures highly correlate with each other and ultimately with the brand’s universe of users. All can be modeled using a Dirichlet distribution model.
The proportion of people who are brand-aware can be modeled from the proportion that are spontaneously aware of that brand. With X number of total users there will be Y number of loyalists and Z number of people who love and recommend the brand. If users drop, liking, awareness and loyalty levels will drop all in parallel. If you asking about liking of brand you will find we all like the brands we use at pretty equal levels.
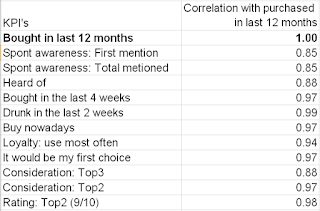
To illustrate the point, here is an example of data taken from a quite typical brand tracking study where the statistical correlation between brands purchased in the last 12 months and all the other core metrics measured in the brand tracking study has been calculated. The correlation for nearly every metric is above 0.85 and some metrics in the high 0.9’s.
So you could argue that the only brand equity question really worth asking in a brand tracking survey is: “Which of these brands do you use?”
Understanding why people buy brands
To measure this it is vitally important that you don’t prompt the respondents for their answers. If you do, these questions will themselves become a proxy measure for brand usage as well.
If you present respondents with a list of brands and an attribute as so many brand trackers tend to do, as it so much easier to associate a brand attribute with the brands you know best than the brands you don’t know, so the brands that get selected the most for each attribute will simply be those brands with the most users. To illustrate this point below is the correlation between purchased in last 12 months and brand attribution for each brand from the same brand tracking survey above and you can see again that it highly correlates.
Below is another example that really helps visualize this issue, it shows the the prompted brand attributes of different telecom services. They correlate on average at c0.85 with brand usage data.
The second reason for not using a promoted brand attribute list is that these lists rarely adequately cover all the diversity of reasons why people actually choose individual brands in individual categories. They are all too often simply generic lists of factors that have little or no relevance to the category. The above example really speaks for itself - ask yourself - do you really make a decision on your choice of telecom provider because it “expresses your personality”? This factor is tenuous at best.
Below are the results of an experiment where we asked people the reasons for purchasing shampoo. We compared their responses to the prompted attribute responses to an open ended question where over 60 distinct factors were given. We discovered that fewer than half the reasons for purchase were covered off in the closed questions.
The third reason for not using a prompted list process is that is does not tell you anything about the relative strength of different factors. If I ask you if price is important when making a purchase, most people will say yes, but that does not tell you anything about how significant price actually is.
To mine reasons for purchase effectively the exercise needs to be done in way that does not anchor responses, and allows the respondent the freedom to express the actual reasons rather than putting thoughts into their heads. We believe the best way to do this is by asking this question in a more spontaneous open ended format linked to the produce usage question. Asking simply why they chose the brand provides produces a much more varied list of responses by brand.
Using fairly basic text analytics techniques can deliver quant level metrics like the example below, demonstrating the influence and scale of each factor similar to a promoted process. The key difference is that you get far greater differentiation of opinions by brand.
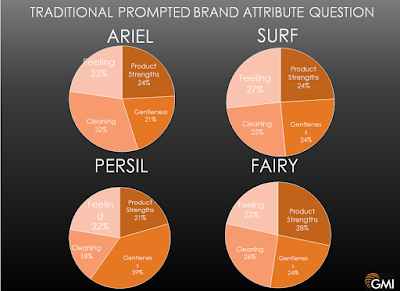
See the example below where the same brand metrics were measured using closed v an open ended approach. You start to see the personality of the brands emerging far more strongly with the open ended question.
Using closed questions all four of these brands are seen as delivering pretty similar levels of cleaning power and gentleness, product strength and feeling. But when you examine the open ended data you see each brand’s unique personality emerging. The perceived cleaning power of Ariel, the gentleness of Fairy for example.
By conducting a detailed analysis of reasons for purchase we were able to show far more than a simple identification and quantification of the primary drivers of purchase. We were able to compare how significant each driver was for each brand. For example below, how often price is mentioned in association with these different shampoo brands varies enormously.
This comparative reason for purchase feedback can also be used to understand the niche issues and micro market movements that you would never normally be produced from a brand tracking survey.
Take the example below of a question we have added to a shampoo tracker for two years running where we asked people to think about the reason why they chose and switched shampoos. In Year 1 we observed 0 mentions of the term Parabins. A year later there were 5 mentions, a tiny number admittedly, but when we examined google search data it was clear that use of Parabins in some shampoos was an emerging and growing issue which was potentially important for marketeers to be aware of.
Take the example below of a question we have added to a shampoo tracker for two years running where we asked people to think about the reason why they chose and switched shampoos. In Year 1 we observed 0 mentions of the term Parabins. A year later there were 5 mentions, a tiny number admittedly, but when we examined google search data it was clear that use of Parabins in some shampoos was an emerging and growing issue which was potentially important for marketeers to be aware of.
From this same tracker we were able to pick up movements on several micro factors of potential interest: UV sun protection (three mentions in Year 1 up to eight in Year 2), caffeine (eight mentions up to 12), ‘2 in 1’ (down from 14 to five), general mentions of “chemicals” (up from 15 to 30). None of these issues would be picked up in a traditional tracker but all are potentially useful insights.
In conclusion, with this approach you not only get a handle on the headline issue but also some of the emerging stories underneath.


good books to learn something is science
ReplyDeleteHello Jon! Thank you for the article. It is interesting as usual. We're translating it now. Can you please explain what you meen "product strength" when talking about attributres of washing powder? Is cleaning power not a part of product strength?
ReplyDeletenice article
ReplyDelete